Prefer video? Here's a demonstration of how to generate PDF reports.
GlassFrog allows users to generate PDF reports with their choice of the data documented in the tool. This feature is available to organizations on both the Free and Premium GlassFrog tiers, but with some differences, discussed below.
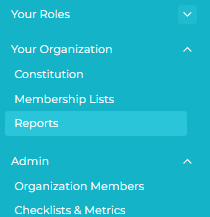
To find the Reports feature, look for the "Your Organization" section of the left-hand sidebar, and under it, click "Reports."
Outputs will only include items that the user would otherwise be able to access, so only organization administrators and members of a particular circle would be able to generate reports with items marked "Private to Circle," and only the owners of items marked "Private to Person would be able to generate reports including those items. Premium subscribers may exclude these from reports they generate in the options.
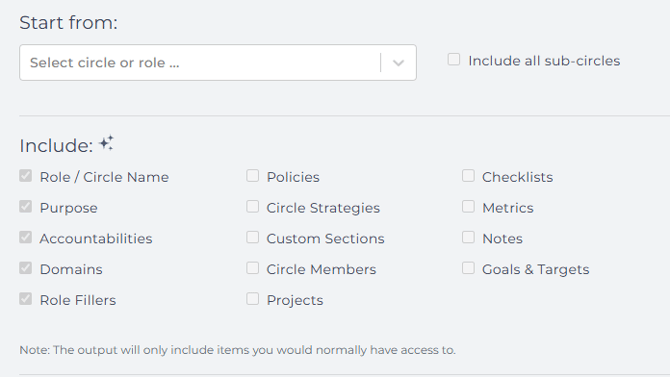
Organizations on the Free plan can generate a PDF report with any circle's data, including the Role/Circle names, Purposes, Accountabilities, Domains, and Role-fillers within that circle. The data categories included are not configurable, and only these categories may be included. Here's what this menu looks like for organizations on GlassFrog Free:
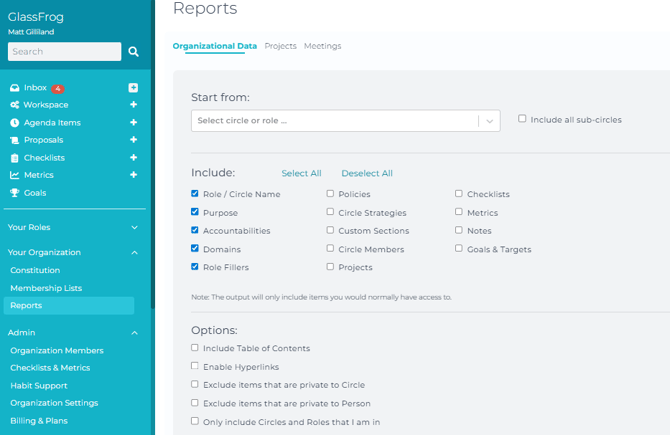
Organizations subscribed to GlassFrog Premium may generate reports that also include all selected data categories for all sub-circles of the selected circle, as well as a number of additional data categories and additional options, such as including a Table of Contents, hyperlinks, and choices over data to include or exclude for organization admins.
To generate a report for the whole organization, select the organization's anchor circle in the dropdown menu, and select "Include all sub-circles" in the checkbox next to it.
Once you have selected the circle and data items you would like included in your PDF report, click "Generate PDF," and your PDF will be downloaded to your browser after a few moments.